
Where AI Actually Pays Off in Austrian Forwarding, 2026
Reading transport requests out of email and drafting quotes is the AI workflow every vendor demos in 2026. It is useful and it is becoming a feature of the mail client and the TMS. It is also the smallest lever in a forwarding business. This paper is about the larger ones: the decisions made from memory in the dispatch office, and what it takes to put software underneath them in Austrian logistics.
Inside
The Austrian figures, seven workflows with their data and KPIs, a maturity model and a 90-day pilot plan
Access
Free with a work email. Read it here or download the PDF.
Dieses Whitepaper gibt es auch auf Deutsch: Zur deutschen Fassung.
The short version
In one paragraph: the ordinary EBIT margin of Austria's 40 largest forwarders fell to 2.1 percent in 2024, about 67 percent of operating output goes to carriers and subcontractors, and 66 percent of transport firms report a strong skilled-labour shortage, the highest of any sector. In a business shaped like that, profit is decided when a price is quoted, when a carrier is chosen, when an exception is handled and when an extra such as waiting time is or is not billed. AI belongs on those decisions, as a layer that reads the TMS, billing, telematics, documents and shipment history and returns a recommendation with evidence that a dispatcher approves.
A groupage forwarder in Upper Austria receives a few hundred transport requests a day by email. Reading one, retyping it into the TMS, looking up the tariff and checking the customer's conditions takes a dispatcher four to eight minutes. Almost every AI vendor demos this workflow, because the input already exists and the output is visible within a sprint.
It works. It is also the shallowest place to put AI in a forwarding business. Microsoft and Google are shipping email extraction inside the mail client, and the TMS vendors are adding it to the order screen. C.H. Robinson, the most public reference for the pattern, went from answering quote emails in 2 minutes 13 seconds in 2024 to 32 seconds in 2026. Once that curve flattens, every forwarder has the same intake speed and no one has an advantage from it.
Seven workflows fit the description of a decision layer well enough to justify a paid pilot today: margin leakage and true lane and customer profitability, pricing guardrails for quotes, carrier intelligence and selection, shipment exception resolution, Standgeld and waiting-time recovery, empty kilometres and backhaul matching, and complex transport planning for heavy and oversized loads. Email-to-quote keeps a role as the entry workflow for firms whose intake is still manual. It is a door, and the rooms behind it are where the margin is.
What follows: the Austrian numbers, why current adoption is shallow, the seven workflows with the data and KPI for each, a four-stage maturity model, the decisions that should stay with people, and a 90-day pilot that produces a measured number rather than a demo. Figures are verified against the sources listed at the end.
Read the full paper
The rest of this page covers the Austrian figures, the seven workflows with their data requirements and KPIs, the maturity model and the 90-day pilot plan. Leave your work email and we will unlock it here, with the PDF to download.
We write from an engineer's address, a few times a year, about this topic. You can stop it with one reply. Details in our privacy policy.
Thanks. The full paper is unlocked below.
Download the PDFThe Austrian pressure, in numbers
The sector's situation in 2026 is well documented by Austrian institutions. These are the figures that matter for where AI is worth deploying.
| Indicator | Figure | Source, year |
|---|---|---|
| Firms in Transport und Verkehr reporting a strong skilled-labour shortage | 66 percent, the highest of all WKO sectors | WKO Fachkräfteradar, 2026 |
| Hardest-to-fill occupations nationwide | Kraftfahrer:innen rank fourth across all sectors | WKO Fachkräfteradar, 2026 |
| Ordinary EBIT margin, 40 largest Austrian forwarders | 4.1 percent (2022), 2.7 percent (2023), 2.1 percent (2024); median 1.8 percent; bottom quartile negative | AK Wien Branchenreport, 2026 |
| EBIT of the same 40 firms, 2024 | EUR 222 million, down 27.9 percent year on year | AK Wien Branchenreport, 2026 |
| Share of operating output spent on bought services | About 67 percent | AK Wien Branchenreport, 2026 |
| Personnel cost per employee | Up 5.0 percent in 2024, up 7.7 percent against 2022, ahead of productivity | AK Wien Branchenreport, 2026 |
| Road freight carried by Austrian carriers, 2025 | 359.8 million tonnes (minus 1.9 percent), 25.8 billion tonne-kilometres (minus 0.9 percent), the fourth annual decline in a row | Statistik Austria, 2026 |
| Truck toll, Euro 6, four or more axles, from 1 January 2026 | 57.24 cent per kilometre excluding VAT; toll rates up about 21 percent over the previous two years | Mauttarifverordnung 2025, WKO position paper |
| Diesel, pump price | EUR 2.26 per litre in late September 2026, up more than 40 percent since January | WKO Kraftstoffpreise, Fachverband Güterbeförderung, 2026 |
| Collective wage increase, Güterbeförderung, 2026 | Plus 2.7 to 3.0 percent for workers, plus 3.05 percent on average for salaried staff | WKO, GPA, 2026 |
| Insolvencies in Verkehr und Lagerei, 2025 | 552 cases, up 12.7 percent; 23.3 insolvencies per 1,000 firms in H1 2026, the highest rate of any sector | Statistik Austria, Creditreform, 2026 |
| European spot market, Q2 2026 | Freight offers up 23.8 percent, available trucks down 10.8 percent; German shipper offers at EUR 2.10 per kilometre, up 13.4 percent | Timocom Transportbarometer, 2026 |
Read together, the table describes a sector where volume falls, every input cost rises, the spot market swings by double digits within a quarter, and the people who absorb all of that in the dispatch office are the ones firms cannot replace. A firm at the AK median earns EUR 1.80 on every EUR 100 of revenue. A mispriced lane, an unbilled day of waiting, a rebooking absorbed without charge or a subcontractor invoice paid above the agreed rate does not dent the margin. It is the margin.
Two consequences follow for anyone planning an AI project in this sector.
First, time saved on typing is real but small. One dispatcher costs the firm roughly EUR 60,000 to 75,000 a year fully loaded. Saving a quarter of that person's time on intake is worth EUR 15,000 to 19,000. The same firm's annual carrier spend is two thirds of revenue. One percentage point of better buying on a EUR 100 million business is EUR 670,000.
Second, the shortage changes what automation has to mean. The WKO survey shows firms cannot hire their way out. Any system that only speeds up a task still needs a person to run it. A system that carries the decision context, so that a less experienced dispatcher makes the same call a twenty-year veteran would, changes who can do the work.
Where adoption is shallow
The only Austrian primary dataset is the study the transport ministry BMIMI commissioned from the Logistikum Steyr at FH Oberösterreich and BearingPoint Austria, published in April 2026 with 80 Austrian firms surveyed. Over 90 percent of them use at least one kind of AI. In the logistics core processes the picture thins out: 24 percent use AI for transport optimisation (35 percent of large firms, 12 percent of small and mid-size ones), and the 194 pages contain no section on dispatch, carrier buying, quote pricing or waiting time.
Beyond Austria, adoption numbers look healthy at first glance. Descartes surveyed 300 European transport and logistics executives in spring 2026 and found that 97 percent use AI somewhere in their operation. The BVL's DACH trend study reports that the use of generative language models among logistics and supply-chain leaders rose from 14.3 percent in 2023 to 52.0 percent in 2025.
The detail is less flattering. In the Descartes sample the most common application is automated data entry at 41 percent, followed by route and load optimisation at 37 percent. Among logistics service providers specifically, both figures are lower, 36 and 31 percent. In the BVL study, AI shows the largest gap between stated relevance and stated competence of all 21 trends surveyed. Firms know it matters and do not yet trust themselves to use it.
Transporeon's Pulse Report 2026, drawn from over 230 shipper and carrier executives in Europe and North America, points the same way from the carrier side: 42 percent of carriers and logistics providers deploy AI for pricing and lane optimisation, 59 percent name that as AI's main value driver, more than half still see AI's primary role as augmenting a human decision, and inconsistent data is the obstacle they cite most.
What this pattern describes is AI applied at the point where data enters the company, and rarely at the point where money is decided. We call the first category intake automation and the second decision workflows, and the distinction drives everything that follows.
Intake automation turns an unstructured input into a structured record: an email into a TMS order, a scanned CMR into a delivery confirmation, a phone call into a status update. The system needs one source and one target. It is cheap to start and easy to demo. It is also, increasingly, a feature of the platforms forwarders already pay for.
A decision workflow joins at least two systems of record and applies business rules or the firm's own history. The output is a recommendation with the evidence behind it, which a person approves or rejects, usually after editing. The system needs access to the TMS, usually billing, often telematics and documents. It is slower to start, because the data has to be reachable and reasonably clean, and it is where the economics of a 2 percent margin business are actually set.
Fraunhofer IML's White Paper 41 from May 2026 is the closest DACH publication to this distinction. It describes AI order capture from email and phone into the TMS alongside transport cost forecasting for quote calculation, and it names under-quoting as a margin risk for small and mid-size forwarders. It stops at describing the methods. No outcome is measured, and every example runs on the institute's own platform.
The US brokerage references show what happens when a firm climbs from the first category to the second. C.H. Robinson's intake automation was already answering around 2,000 quote emails a day in 2024. By 2025 the company reported a 30 percent productivity gain across 2023 and 2024 and over a million AI-generated quotes. In March 2026 it reported quotes in 32 seconds, orders in 90 seconds, appointments automated at 42,000 locations and a 42 percent reduction in missed pickups, the last figure coming from agents that check appointment and pickup data rather than from reading email. RXO automated more than 500,000 phone calls in the first quarter of 2026 and reports loads per person per day up 15 percent. project44 claims a 17 percent reduction in manual exception handling for customers of its agent products, and a slot-booking agent that cut detention charges by a similar share.
Two cautions apply before carrying these numbers into an Austrian sales conversation. These are brokers and platform vendors whose product is the quote and the match, operating at volumes no Austrian mid-size forwarder sees. Their figures are upper bounds. And the headline numbers mostly come from the vendors themselves, with no independent audit. Treat them as evidence that the category works at scale, and nothing more precise than that.
The Austrian equivalent of the C.H. Robinson curve is unlikely to be a faster quote. It is more likely to be a quote that is right about the margin, a carrier choice that is right about reliability and a Standgeld claim that is actually raised.
Seven workflows where the money is
Each workflow is described the same way: what goes wrong today, what the system does, which data it needs, how it is measured, how mature the technology is for an Austrian mid-size forwarder, and where it fails. The order is roughly by commercial weight for a road-freight or groupage Spedition. A forwarder with a large own fleet or a heavy-haul specialism will reorder them.
1. Margin leakage and true lane and customer profitability
What goes wrong. The quoted margin on a lane is six percent. Three weeks later the contribution margin on the executed shipment is under two. Nobody is surprised, because nobody looked. The quote lives in the TMS or in a spreadsheet, the planned carrier cost in a rate table, the actual carrier invoice in the billing system, the waiting time in a driver's text message, the toll in a monthly ASFINAG statement and the rebooking in an email thread. Reconciling one shipment takes an hour. Reconciling a month of a customer's shipments never happens, so prices are renegotiated on gut feeling.
What the system does. It reconstructs the full cost path for every executed shipment: quoted price, planned cost, actual carrier cost, surcharges and extras, operational events that caused them, and final contribution margin. It classifies leakage into named causes such as carrier bought above plan, unbilled waiting time, empty repositioning, rebooking after customer change, toll class mismatch and claims. It aggregates by lane, customer, carrier and month and flags the combinations where the quoted and realised margin diverge consistently.
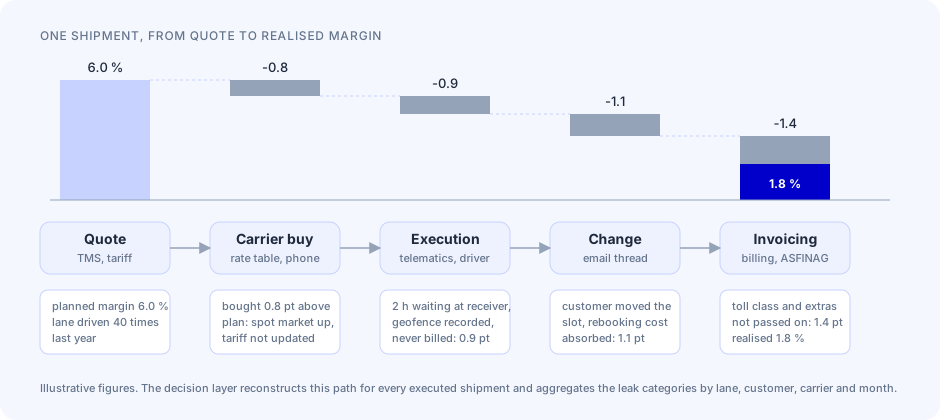
Data. TMS orders and quotes, carrier rate agreements, carrier invoices and self-billing records, customer invoices, telematics events where available, and 12 to 24 months of history. No customer or carrier interaction is required, which is why this workflow is a good first project: it reads what the firm already owns.
KPI. Contribution margin recovered or protected, measured as the difference between realised margin on affected lanes before and after pricing or carrier changes. Secondary: share of shipments with a reconstructed cost path, time to a customer profitability answer.
Maturity. Decision support today. The joining and classification work is well within current tooling. The hard part is data hygiene: order numbers that do not match across systems, invoices without shipment references, rate tables maintained in three places.
Where it fails. When carrier invoices arrive weeks late and without shipment references, the reconstruction lags so far behind that the pricing decision has already been made. When the firm's own cost allocation is arbitrary, the system inherits the arbitrariness. The output is only as credible as the cost model the CFO signs off.
2. Pricing guardrails for quotes
What goes wrong. A dispatcher prices a spot request for a lane the firm drove forty times last year. The price comes from a tariff that was set in a different diesel and toll environment, adjusted by instinct. In the Q2 2026 spot market, with shipper price demands in Germany up 13.4 percent in a year and capacity down more than 10 percent, instinct lags the market by weeks.
What the system does. For each incoming request it returns a recommended price corridor: the floor below which the lane has historically lost money and the target that meets the firm's margin rule, each with the reference points behind it, such as the last ten executed shipments on the lane, current carrier availability, toll class, fuel index and the customer's payment and claims history. The dispatcher sees the corridor next to the quote field and can override it. Overrides are logged with a reason.
Data. Everything from the margin workflow plus a fuel and toll index feed, and ideally the firm's own spot buying history on freight exchanges.
KPI. Win rate at or above target margin. Share of quotes within the corridor. Realised margin on quoted lanes compared with the previous period.
Maturity. Decision support today. Fully dynamic pricing without human review is possible for standardised groupage tariffs, and we would not recommend it in the first year for anything else.
Where it fails. Thin history on a lane produces a wide corridor that tells the dispatcher nothing. Customer relationships that justify a strategic loss on one lane need to be modelled explicitly or the system will keep flagging them. A corridor that is ignored nine times out of ten is a sign the cost model is wrong, and that has to be fixed before anyone blames the dispatcher.
3. Carrier intelligence and selection
What goes wrong. Two thirds of a forwarder's cost is carriers and subcontractors. The choice of carrier for a given load is made by the dispatcher who happens to be on shift, from memory of who was reliable last month and who picked up the phone. When that dispatcher leaves, and the WKO figures say they will, the memory leaves with them.
What the system does. It ranks available carriers for a load on price, lane history, punctuality, claims, cancellation rate, equipment fit, responsiveness and relationship history, and shows the ranking with the underlying figures. It can draft the request to the top candidates and, at a later maturity stage, place the request itself inside pre-agreed limits.
Data. TMS carrier master data, executed shipments with planned and actual times, claims register, cancellations and no-shows, carrier communication history, equipment and certificate data, and current availability from phone, email or freight exchange.
KPI. Carrier cost per lane against the historical average at equal service level. On-time rate. Cancellation rate. Dispatcher minutes per carrier assignment.
Maturity. Decision support today. Optimisation, where the system assigns and books within constraints, is feasible for standard lanes once six months of ranked decisions and outcomes have been recorded.
Where it fails. Relationship capital is real. A carrier that has bailed the firm out at Christmas for ten years should not be dropped because of a ranking, and the model needs an explicit field for that. Punctuality data is only as good as the status discipline of the drivers. Firms without telematics or systematic status capture will get a price ranking, which they already have.
4. Shipment exception resolution
What goes wrong. A truck is three hours late at a receiver with a booked slot. The dispatcher finds out from the customer. Resolving it means opening the TMS, checking telematics, calling the driver, calling the receiver, checking the slot rules, deciding whether to rebook or wait, and writing to the customer. Thirty to sixty minutes of a dispatcher's attention per exception, repeated many times a day.
What the system does. It detects or receives the exception, assembles the context from the TMS, tracking, documents and recent communication, determines the likely cause, recommends a recovery action from the firm's own playbook, drafts the customer and carrier communication, and executes the permitted steps after approval. Over time the playbook becomes explicit, which is a benefit in itself.
Data. TMS, telematics or tracking, slot-booking systems, customer SLAs, the email and phone channel, and a record of past exceptions and how they were resolved.
KPI. Minutes of dispatcher time per exception. Time from detection to customer information. Share of exceptions resolved within the first proposed action.
Maturity. Decision support today, with bounded execution for low-risk steps such as informing the customer, rebooking a slot, asking the receiver to hold it or requesting a new ETA from the driver. Fully autonomous resolution exists at platform vendors and belongs at the fourth stage of the maturity model below for a mid-size forwarder.
Where it fails. Without reliable tracking, detection is the customer's phone call, and the system only speeds up the paperwork afterwards. Customer communication that goes out unreviewed and wrong costs more trust than the time saved. The first version should draft and wait.
5. Standgeld and waiting-time recovery
What goes wrong. Austrian standard forwarding conditions say nothing about Standgeld; it is purely contractual, which means every customer has different free time and different rates, and a claim stands or falls on evidence. A typical Austrian shipper condition grants 24 hours free and then caps compensation at EUR 150 per truck and day. The Supreme Court has upheld contractual Standgeld of EUR 420 per started 24 hours as part of the freight remuneration. German surveys of ramp waiting have found that most carriers wait more than 30 minutes on average and almost half more than an hour; there is no recent Austrian study, which is itself a finding. Most of this waiting is never billed, because the driver's note, the geofence event, the stop plan and the contract clause never meet.
What the system does. It combines telematics or geofence events with the agreed free time per customer and site, the CMR or delivery note timestamps and the customer's rules, detects billable waiting, assembles the evidence pack and drafts the claim line for the invoice. A person reviews before it goes out.
Data. Telematics with site geofences, customer contracts with the waiting-time clause structured, TMS stop plans, scanned CMRs or delivery notes with arrival and departure times.
KPI. Waiting charges recovered per month. Share of waiting events with a complete evidence pack. Dispute rate on raised claims.
Maturity. Automation with decision support today. Of the seven workflows this is the most mechanical and the quickest to pay back, provided telematics exist.
Where it fails. No telematics, no workflow. Firms running mostly subcontracted capacity get only the subcontractors' claims against them, which is a cost control case rather than a recovery case, still useful and differently shaped. Some customer relationships will not tolerate systematic Standgeld billing, and that is a commercial decision a person takes per customer before the system is switched on.
6. Empty kilometres and backhaul matching
What goes wrong. Eurostat data cited by the VCÖ put the empty share of truck kilometres in Austria at 34 percent in 2019, up from 31 percent a decade earlier. There is no more recent published Austrian figure, and nothing in the cost environment since suggests the share has fallen. Every empty kilometre in 2026 carries 57 cent of toll and roughly 70 cent of diesel before the driver is paid.
What the system does. For a fleet, it forecasts where vehicles will become free and matches them against the firm's own order book, regular customer lanes, partner carriers' return needs and freight-exchange offers, proposing backhauls and round trips that the dispatcher accepts or declines. For a forwarder without a fleet, the same logic runs on subcontractor capacity the firm controls.
Data. Order book with time windows, vehicle positions and planned routes, driver hours, historical lane demand, and freight-exchange access.
KPI. Empty kilometres as a share of total kilometres. Revenue per loaded kilometre. Share of proposed backhauls accepted.
Maturity. Optimisation. This is a planning problem with hard constraints, and the AI contribution is in forecasting availability and demand and in reading unstructured offers, while the matching itself should be a solver. Firms with a route-planning module in their TMS should extend it rather than replace it.
Where it fails. Driver hours and customer time windows make most theoretical backhauls infeasible, and a system that proposes them anyway loses the dispatcher in a week. Start with the firm's own order book; freight-exchange matching comes later.
7. Complex transport planning for heavy and oversized loads
What goes wrong. A heavy-haul or vehicle-logistics request combines dimensions and weight, vehicle and trailer constraints, permit requirements per Bundesland and country, route restrictions such as bridge classes and tunnel categories, escort rules, loading method and the customer's deadline. One planner holds most of this in their head. A quote takes a day. If that planner is on holiday, it takes a week.
What the system does. It takes the request and returns a proposed feasible plan: vehicle combination, candidate route with known restrictions, permit list with lead times, escort requirement and a cost build-up, together with the rules it applied and the ones it could not verify. The planner corrects it and the corrections feed the rule base.
Data. The firm's own past transports with plans and outcomes, permit records, vehicle and equipment database, route restriction data, and the planner's rules written down for the first time.
KPI. Hours from request to quote. Share of plans accepted with minor edits. Permit rework rate.
Maturity. Decision support, and early. The value is high because the alternative is a scarce specialist, and the risk is high because the rules are safety-relevant. Every plan is reviewed by a qualified person; the system's job is to make the first draft take an hour instead of a day.
Where it fails. Route restriction data is incomplete and changes. A plan that looks complete and is wrong about one bridge class is worse than no plan, which is why the system must show what it could not verify rather than fill the gap.
Where email-to-quote still earns its place
Everything above assumes the firm has structured data about its own shipments. Many Austrian forwarders with 30 to 200 office staff do not, because their intake is still a person reading an email and typing. For them, email-to-quote remains the correct first project, with two conditions attached.
The first condition is that it is built as the intake layer of the decision workflows above, writing structured requests into the TMS with the fields that margin analysis and pricing guardrails will later need, rather than as a standalone reply bot. The second is that the firm understands it is buying a door. Within two years the same capability will be a checkbox in the mail client and the TMS, and the forwarder's advantage will come from what it did with the structured data in the meantime.
Economics and KPIs
The table collects the measurable quantity for each workflow and the simplest defensible way to compute it.
Oliver Wyman's November 2025 review of logistics operators puts cost reductions at 10 to 25 percent across operational pools and the aggregate EBIT uplift at 1 to 2 percent, with 1 percent for forwarding specifically, EUR 0.5 to 1 million invested per application and 6 to 12 months to deployment. Those are figures for operator groups. The worked numbers below are for a single EUR 100 million forwarder and sit inside that range.
| Workflow | Primary KPI | Formula | Inputs the firm usually has | Baseline needed before pilot |
|---|---|---|---|---|
| Margin leakage | Contribution margin recovered | (realised margin after minus realised margin before) x revenue on affected lanes | Quotes, carrier invoices, customer invoices | 12 months reconstructed on a sample of 50 to 200 shipments |
| Pricing guardrails | Win rate at target margin | won quotes at or above target / all quotes, compared with the prior period | Quote log with outcome | Three months of quotes with win or loss recorded |
| Carrier selection | Carrier cost per lane at equal service | average carrier cost per lane after / before, on-time rate held constant | Carrier invoices, delivery times | Six months of assignments with outcomes |
| Exception resolution | Minutes per exception | dispatcher minutes per exception, sampled before and after | Dispatcher time study, exception log if it exists | Two weeks of logged exceptions with time stamps |
| Standgeld recovery | Waiting charges recovered | sum of accepted waiting claims per month | Telematics, contracts, invoices | One month of geofence events matched to contracts |
| Empty kilometres | Empty share of total km | empty km / total km per month | Telematics or TMS trip data | Three months of trip data |
| Complex planning | Hours from request to quote | median elapsed time, sampled | Request and quote time stamps | Twenty recent requests |
Two worked numbers show the scale against the AK data. Take a forwarder with EUR 100 million revenue at the 2024 median ordinary EBIT margin of 1.8 percent, so EUR 1.8 million EBIT. If margin leakage analysis and pricing guardrails lift realised margin by 0.3 percentage points on half the revenue, that is EUR 150,000, an 8 percent increase in EBIT from a project that reads data the firm already has. For a fleet operator with 80 trucks and telematics, assume one unbilled waiting event per truck and week at a conservative EUR 60, well under the EUR 150 daily cap in typical Austrian conditions. That is 80 x 52 x 60, about EUR 250,000 a year, before disputes. Both numbers are illustrations; the pilot's purpose is to replace them with the firm's own.
The honest comparison figure is the intake saving: a quarter of a dispatcher's loaded cost, EUR 15,000 to 19,000 a year per dispatcher, which is real and should be taken, and is an order of magnitude smaller.
Data and system requirements
Every workflow above reads from the same handful of systems. The figure shows the shape we would build.
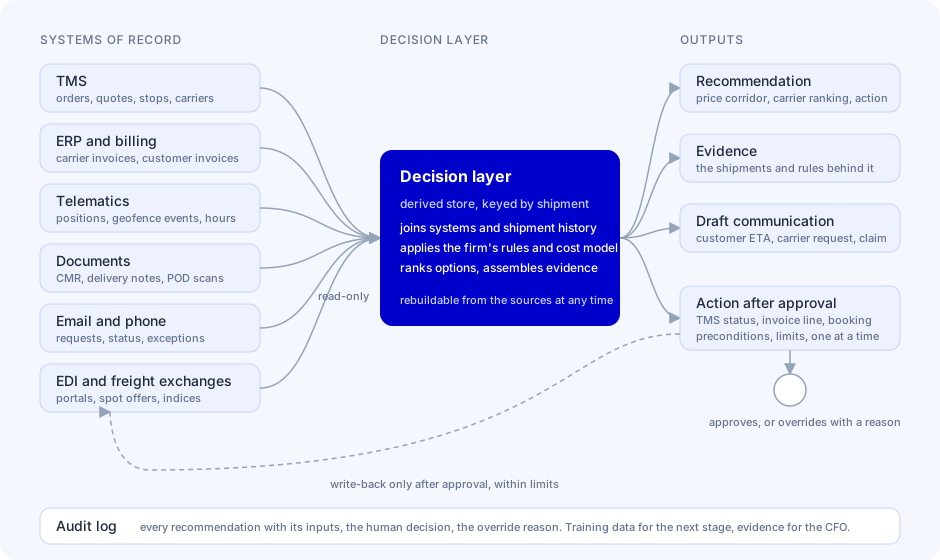
Systems of record stay where they are: the TMS (in Austria typically one of CarLo, LBase, WinSped or a vertical product, occasionally SAP TM), the ERP or billing system, telematics, the document store with scanned CMRs and delivery notes, the mail server, customer portals and EDI, and freight exchanges. The decision layer never becomes the master for any of this data.
The decision layer is a derived store. It pulls orders, quotes, invoices, events and documents into one place keyed by shipment, applies the firm's rules and models, and produces four kinds of output: a recommendation, the evidence behind it, a draft communication and, when permitted, an action to write back such as a TMS status, an invoice line or a carrier booking.
The architectural point is the one Martin Kleppmann makes about derived data in Designing Data-Intensive Applications: a view computed from systems of record can always be thrown away and rebuilt from them, which is what makes it safe to iterate on. When the margin model changes, the whole history is recomputed overnight. When the model is wrong, nothing in the TMS has been corrupted. This is also the argument against letting an AI tool write directly into the TMS in month one.
Write-back is governed. The first three months are read-only. Actions are added one at a time, each with a precondition check, a limit and a log entry. Informing a customer of a new ETA comes early. Placing a carrier booking above a value threshold comes late or never.
Every recommendation is logged with its inputs and the human decision, including overrides and their reasons. This record is the training data for the next maturity stage and the audit trail the CFO and the works council will ask for.
Data readiness, in practice
Before proposing a workflow we check six things with the firm:
- Can an order in the TMS be joined to the carrier invoice and the customer invoice by a shared reference, for most shipments?
- Does the firm have telematics or systematic status capture, and for what share of movements?
- Are carrier rate agreements and customer tariffs stored in a structured form, or in PDFs and heads?
- How far back does clean history go?
- Who owns each system, and can a read-only export be arranged in weeks rather than quarters?
- Is there a data processing agreement template and an EU hosting requirement, and who signs it?
The answers decide the workflow. No telematics rules out Standgeld and backhaul work for now. No joinable invoices makes margin analysis a data project first. Strong intake data and weak execution data point at pricing guardrails. The decision gate is simple: if the firm cannot produce the baseline in the last column of the economics table within a month, the pilot is premature and the honest proposal is a data readiness engagement.
A maturity model
Four stages, each defined by what the system does and what the human does. Most Austrian forwarders in 2026 are at stage one in intake and at stage zero in everything else. The sensible target for the first year is stage two in two or three workflows.
| Stage 1: Automation | Stage 2: Decision support | Stage 3: Optimisation | Stage 4: Autonomous operations | |
|---|---|---|---|---|
| What the system does | Converts an input into a record or a draft | Joins systems and history, returns a ranked recommendation with evidence | Chooses among options under explicit constraints and proposes a plan | Executes within policy limits, escalates exceptions |
| What the person does | Checks and corrects the output | Decides, overrides with a reason | Reviews the plan, adjusts constraints | Sets policy, reviews the log, handles escalations |
| Data required | One source, one target | Two or more systems of record, 6 to 24 months of history | Stage 2 plus constraints encoded (hours, windows, equipment, contracts) | Stage 3 plus outcome feedback on every decision |
| Control mechanism | Human review of each output | Logged recommendations and overrides | Constraint set owned by operations | Policy file, limits, preconditions, audit log, kill switch |
| Example workflows | Email-to-quote intake, CMR reading, status calls | Margin leakage, pricing corridor, carrier ranking, exception context | Backhaul matching, slot allocation, standard-lane carrier assignment | Low-risk exception steps, routine bookings within limits |
| Typical failure | Wrong extraction goes unnoticed | Recommendations ignored because the cost model is not trusted | Infeasible plans from incomplete constraints | Policy too wide, or no one reads the log |
| Austrian mid-size firms, 2026 | Starting | Rare | Partial, inside TMS route planning | Not observed |
The stages are cumulative. Skipping to stage three without the logged decisions of stage two produces an optimiser nobody trusts, and skipping to stage four without stage three's explicit constraints produces an agent nobody should trust.
What not to automate
The conversation is more credible when it names the decisions that should stay with people. Our list for a forwarding business:
- Final price on unusual lanes or strategic customers. The corridor informs; the person decides. A customer relationship that justifies a loss on one lane cannot be seen in shipment data.
- Dropping a carrier. Rankings should change the order in which carriers are asked. Ending a relationship is a management decision with information the system does not have.
- Customer communication about claims, damage, liability or delay penalties. Drafts are fine. Nothing with legal weight goes out unreviewed.
- Dangerous goods and heavy-haul compliance decisions. The system prepares and checks; a qualified person signs.
- Anything where the input data does not exist. Waiting-time recovery without telematics, carrier scoring without status discipline, backhaul matching without vehicle positions and margin analysis without joinable invoices will produce confident output from nothing. The right answer to a firm without the data is a data project, and saying so early is what separates an engineering partner from a vendor.
- Headcount decisions. The WKO figures say firms cannot hire dispatchers. The point of decision support is that the dispatchers the firm has can carry more and make fewer expensive calls. Framing a pilot as a headcount project in a sector with a 66 percent shortage is both wrong and bad for the works council conversation.
A realistic 90-day pilot
The pilot has one purpose: a number the owner believes, measured on their own data, for one workflow. Everything else is scope creep.
Days 1 to 30: discovery and data audit
Pick the workflow using the readiness checklist above. Sign NDA and data processing agreement; EU hosting, read-only access, no training on the firm's data. Arrange exports from the TMS and billing. Reconstruct the baseline on a sample: 50 to 200 shipments for margin leakage, a month of geofence events for Standgeld, two weeks of logged exceptions for exception handling, twenty recent requests for complex planning. Agree the single KPI and its formula in writing with the owner and the operational sponsor. The output of the month is a baseline document the CFO accepts.
Days 31 to 60: shadow mode
The decision layer runs on live data. Recommendations are produced and logged but not shown to the operational team, or shown without being acted on. Each week the team compares the system's recommendation with what was actually decided and marks whether it agrees and, if not, why. Models and rules are corrected from these marks. The output of the month is an agreement rate and a list of the cases where the system was right and the team was not, and the reverse.
Days 61 to 90: assisted mode
Dispatchers or sales see the recommendation and the evidence at the point of decision and act on it or override with a reason. Low-risk draft actions, such as a customer ETA message or a waiting-time invoice line, go out after a click. The KPI is measured against the baseline for the full month. The output is a results meeting with the owner showing the measured delta, the cost model behind it, the override log and a proposal for the next workflow or the next maturity stage.
Four rules make this work. One workflow and one KPI, with a sponsor who can get data exports approved in days. The KPI formula agreed in writing before day 30, so the results meeting argues about the number and never about its definition. Shadow mode before assisted mode, because the agreement rate is what earns the team's trust and it cannot be skipped. And the result is reported as measured, including when it is smaller than the sales deck promised, because the second project depends on the first number being believed.
Where this leaves the demo
The intake demo is attractive because it shows AI doing something visible with no integration. That is also why it will become a commodity feature of the systems forwarders already run. The workflows in this paper are harder to start, because they depend on the firm's own data being reachable and joinable, and that difficulty is exactly what makes them defensible once built. A pricing corridor trained on ten years of a firm's own lanes is something no TMS vendor can ship as a checkbox.
The sector's numbers set the agenda. At a 2 percent margin, with two thirds of cost bought in and the people who make the buying decisions in short supply, the useful question is which decisions are made from memory today and what the memory is worth. The answer differs by firm, and it is always larger than the time spent typing.
Sources
Austrian market data
- WKO Fachkräfteradar 2026 (ibw Forschungsbericht Nr. 228, survey of 2,132 member firms, April 2026)
- AK Wien, Branchenreport Speditionen und Logistik 2026 (40 companies, FY 2022 to 2024)
- Statistik Austria, Straßengüterverkehr österreichischer Unternehmen 2025
- Statistik Austria, Insolvenzen Q4 2025 and Creditreform, Insolvenzstatistik H1 2026
- WKO, Lkw- und Bus-Maut in Österreich 2026 and Positionspapier Mauterhöhungsstopp
- WKO Kraftstoffpreise der Woche and Fachverband Güterbeförderung, 17 September 2026
- WKO, Kollektivvertrag Güterbeförderung 2026 and GPA, KV-Abschluss 2026
- VCÖ, citing Eurostat, Lkw-Leerfahrten in Österreich (2019 data)
- OGH 7 Ob 45/13p on contractual Standgeld, and Keimelmayr Ladebedingungen as an example of shipper terms
- VerkehrsRundschau-Index on ramp waiting times
- Timocom Transportbarometer Q2 2026
- BMIMI, FH OÖ Logistikum Steyr and BearingPoint Austria, Möglichkeiten von KI in der Logistik in Österreich (December 2025, 80 firms)
Adoption surveys
- BVL, Trends und Strategien in Logistik und Supply Chain Management 2025/26 (n = 202)
- Descartes, European transport and logistics AI survey, May 2026 (n = 300, reported by Logistik Heute)
- Transporeon, Transportation Pulse Report 2026 (press release, December 2025, over 230 respondents)
- Fraunhofer IML, White Paper 41: KI in der Logistik (May 2026)
- Oliver Wyman, How Logistics Operators Harness AI To Boost Efficiency (November 2025)
Vendor and operator references (self-reported, treat as upper bounds)
- C.H. Robinson: FreightWaves, May 2024; press release, April 2025; newsroom, March 2026
- RXO, Q1 2026 earnings presentation (SEC 8-K)
- project44, decision44 announcement (FreightWaves)
FAQ: AI in Austrian logistics
Is email-to-quote automation still worth doing for a forwarder?
Yes, where intake is still manual, and only as the first layer. Build it so that structured requests land in the TMS with the fields that margin analysis and pricing guardrails need later. The capability itself is becoming a feature of mail clients and TMS products, so the advantage comes from what is done with the structured data afterwards.
Which AI workflow should an Austrian Spedition start with?
Margin leakage analysis for most forwarders, because it reads data the firm already owns and needs no customer or carrier interaction. Standgeld recovery for fleet operators with telematics, because it is the most mechanical and pays back fastest. The data readiness check decides between them.
What data does a forwarder need before an AI pilot makes sense?
Orders in the TMS that can be joined to carrier and customer invoices by a shared reference, structured rate agreements and tariffs, 12 months of clean history, and for waiting-time or backhaul work, telematics with site geofences. Without these the honest proposal is a data readiness project.
How long until there is a measurable result?
Ninety days for one workflow and one KPI. The first month builds the baseline, the second runs in shadow mode and measures agreement with the team's actual decisions. The third runs assisted and is measured against the baseline. The result is reported as measured, including when it is smaller than estimated.
Further reading
Agent-Ready Infrastructure: four patterns for running AI agents in production